Page Performance Tool
WP Engine Page Performance is a solution designed to help you increase your page speed and conversions by executing page-level performance tests and providing actionable recommendations.
About Page Performance
Page performance depends on many factors including server location, connection speed, and the brand of browser.
In our simulated Page Performance test environment, the server is located in a data center in northern Virginia and the page is loaded in the latest version of Chrome, over a standard cable connection (5/1 Mbps 28ms RTT). When looking at the data, please keep in mind that results may vary depending on your visitor’s location and connection.
Behind the scenes, we run each test three times and report metrics representing the average of all three.
If Basic Authentication is enabled or it is Transferable, render times may be increased. This is typically resolved after taking the site live and removing the additional authentication forms.
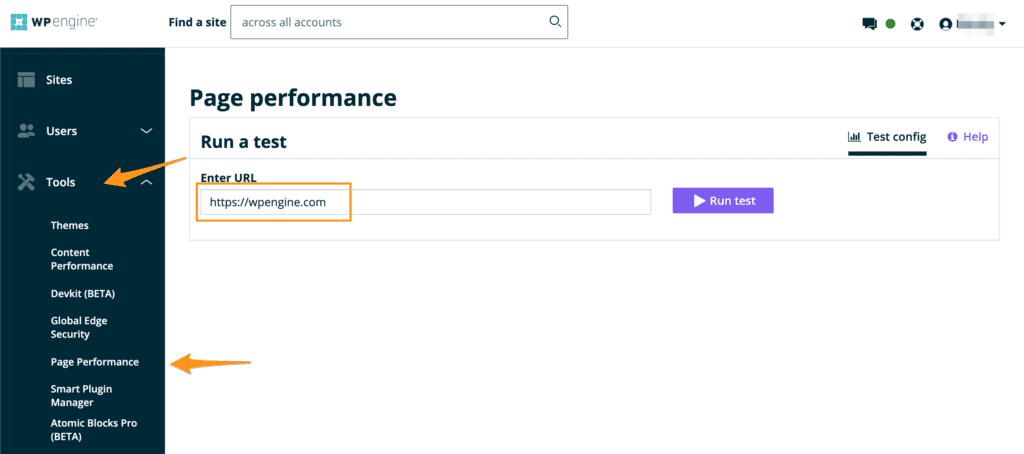
Access Page Performance
- Log into your WP Engine User Portal
- Click Tools
- Click Page Performance
- Enter the URL of any page you want to analyze
- Click Run test
We will email you a summary of your Page Performance results when they’re ready. The report can take several minutes to generate, so feel free to perform other tasks while it’s being generated.
At the bottom of this page, you’ll see a history of past tests submitted by the users on your WP Engine account. If multiple tests on the same URL have been run, each resulting metric will include arrows showing the difference in that metric since the previous report (EX: “Down 0.09”).
NOTE: Historic records are retained for the 6 months.
Page Performance Summary
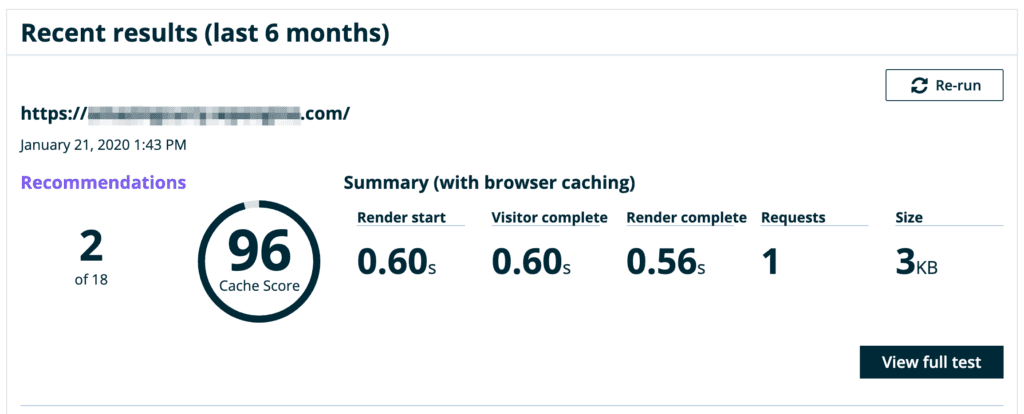
Recommendations: We’ve analyzed your page and made a set of recommendations to improve load times and page speed. There are 19 possible recommendations, and they’re based on best practices proven to be highly successful.
Render start: The number of seconds it took, after navigation, for the browser to display the first object on the screen. From the visitor’s viewpoint, this is when the page starts loading.
Visitor complete: The average time at which all visible parts of the page are displayed. For visitors, this is when he or she perceives the page to be fully loaded, even if resources are still running in the background.
Render complete: The number of seconds it took, after navigation, for there to be at least two seconds of no network activity. This number is essentially when the page is considered to be absolutely “complete.”
Requests: The number of resources requested by the page. Resources include images, fonts, HTML and scripts.
Size: The total file size of all the elements transferred from your page to the visitor’s browser.
Filmstrip
This is a timeline that represents how the page loaded in the test. It starts at the left, where time equals 0 seconds from navigation, and ends at “Render complete.”
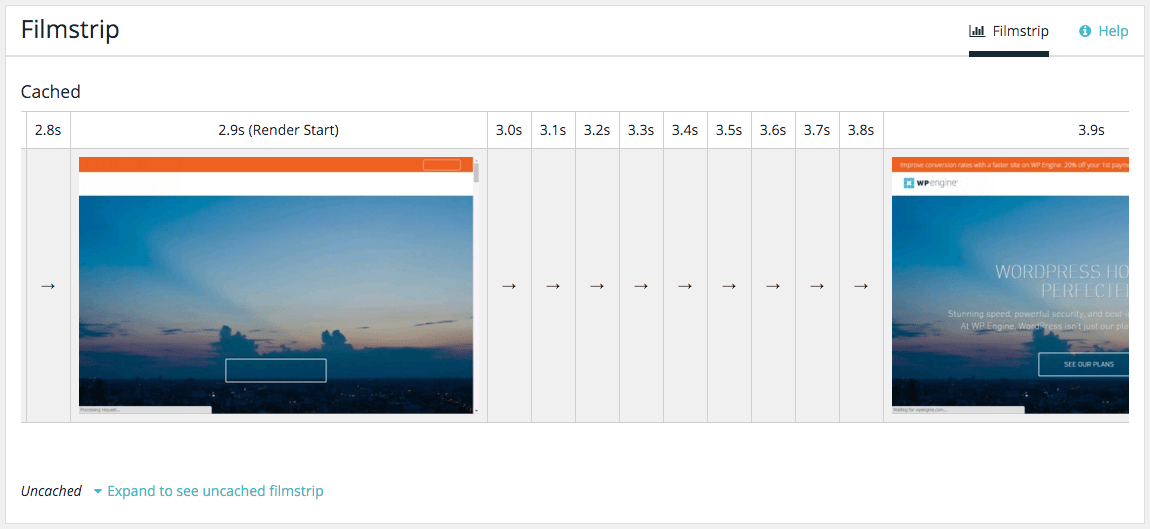
At certain milestones, such as “Render start,” you’ll see an image of what the page looked like at that moment in time. This can help you understand how a visitor would have experienced the page being loaded.
Recommendations
With most of our recommendations, we include links to our Support Garage and outside resources where you can learn more. In some cases, we recommend WordPress plugins that can be used to help fix the problem.
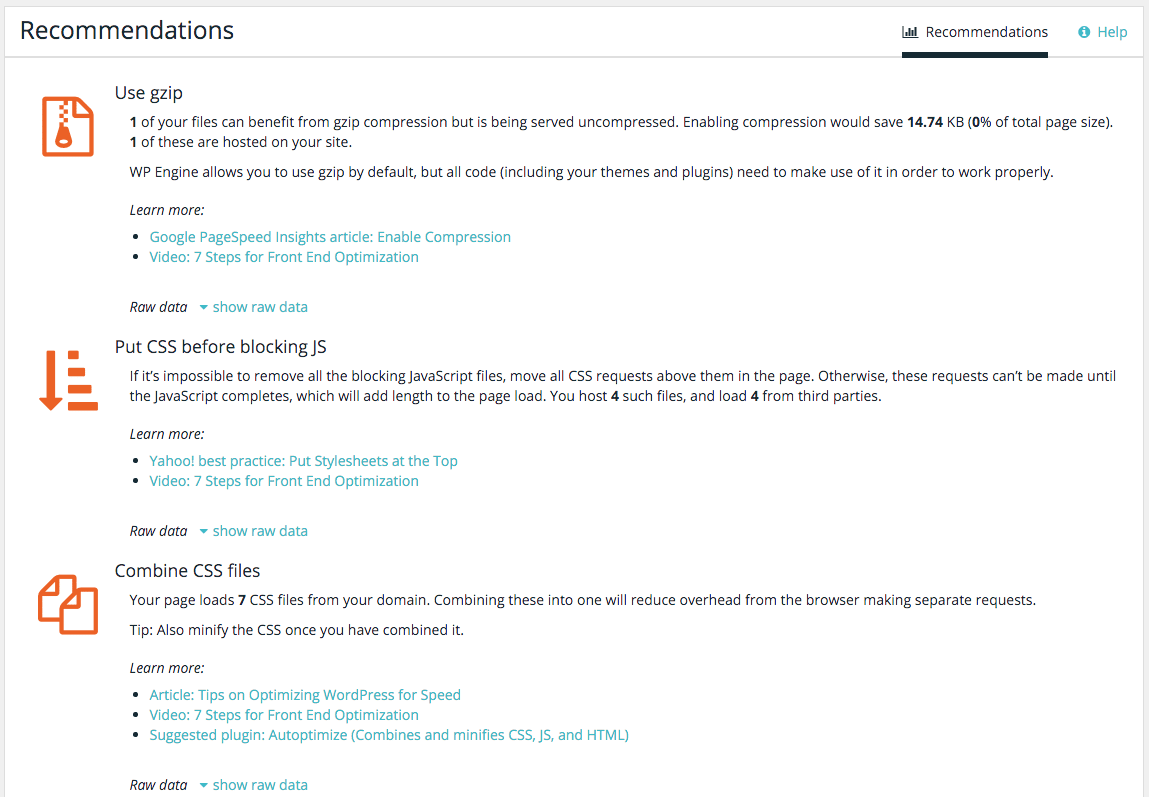
Our suggestions are based on web and WordPress best practices. However, any given recommendation may not apply to your site in context. Please evaluate them carefully before making changes.
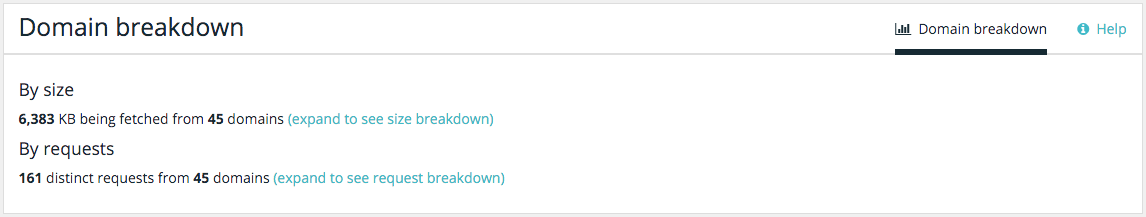
Domain Breakdown
In this section, we display the number of domains requested by the page, as well as the total file size returned by those domains (in kilobytes). We’ve also summarized the list of domains and show the amount of data returned by each one. Note that some of these requests are generated by WP Engine’s platform.
Schedule Recurring Tests
After you have run a test for a URL at least once, this test will appear in your report history.
You can click the View Full Test button to see the test details. In addition, you can choose Schedule Recurring button in order to schedule regular, automated runs of Page Performance tests.
There are two main options when scheduling Page Performance tests:
- Select test frequency (choose from Once per week, Twice per month, and Once per month, and Unschedule this URL).
- Select test alert recipient (choose the current account user that the report notification email should be sent to, or optionally, choose not to send a report notification email each time the test runs by selecting Notification disabled).
Note: If you choose ‘Notification disabled’ option, the test will still run according to the selected frequency, and it will appear in your Report List history so that you can review the results of each run, but no user will receive an email when the report is run. Always be sure to save your selections.
Modify a Test Schedule
After you schedule a test, you can see what the current frequency is as well as modify the frequency or the test alert recipient by selecting the Change [Daily/Monthly] Schedule button on the test details page. All tests that are run via a schedule will appear in the report history along with any manual test runs completed via the Run Test button so you can review the results in the same way.
Unschedule a Test
If at any time you would like to unschedule a URL, you can choose this option by selecting the Change [Daily/Monthly] Schedule button on the test details page. Under Select test frequency, choose the Unschedule this URL radio button and save your selections. The test will no longer run according to a schedule but can still be run manually.
Occasionally you may see the test return the following error:
Your test encountered a "401 Unauthorized" response from the requested site. This occurs when the site is protected by a password using HTTP Basic Auth.

You can format the URL with the appropriate credentials and try your test again. (Please be aware that Basic Auth credentials are transmitted without encryption.)
This error occurs when your site is protected by Basic Authentication, where a secondary set of login credentials are required to view the website.
To run a page performance test on a website protected with Basic Authentication you will need to enter the domain into the test as follows:
Where username is the basic auth user name, and password is the basic auth password.